Complete GMAT Data Insights Preparation Guide: Syllabus, Tips & Practice Questions
1. What the Data Insights Section Is Really Testing
The Data Insights (DI) section of the GMAT measures how well you can read, organize, compare, and draw conclusions from information. The information may appear as text, tables, charts, graphs, dropdown statements, or multiple tabs. In business school and management work, decisions are rarely based on one clean equation; they are based on incomplete-looking data, multiple sources, changing units, and constraints. DI simulates that environment.
A strong DI student is not necessarily the student who performs the most calculations. The stronger student usually does three things better: identifies what the question is truly asking, locates only the relevant information, and uses estimation or structure to avoid unnecessary work.
2. Format, Timing, and Syllabus
The current GMAT has three sections: Quantitative Reasoning, Verbal Reasoning, and Data Insights. The full exam is 2 hours and 15 minutes long, with 64 total questions and one optional 10-minute break. Data Insights contains 20 questions in 45 minutes. Official GMAT preparation guidance identifies five DI question types: Data Sufficiency, Multi-Source Reasoning, Table Analysis, Graphics Interpretation, and Two-Part Analysis.
| Area | Current GMAT format |
|---|---|
| Data Insights questions | 20 |
| Time | 45 minutes |
| Average pace | 2.25 minutes per question |
| Calculator | On-screen calculator available in DI |
| Question types | Data Sufficiency, Multi-Source Reasoning, Table Analysis, Graphics Interpretation, Two-Part Analysis |
| Scoring relevance | Counts toward the total GMAT score |
The exact mix of question types can vary from test to test, and some DI questions contain multiple parts. For multi-part questions, you should assume that all requested parts must be correct for full credit. That makes careful reading and disciplined checking especially important.
3. The Data Insights Syllabus: What to Know
| Question type | What appears on screen | Core skills tested | Main trap |
|---|---|---|---|
| Data Sufficiency | A question plus two statements | Sufficiency logic, algebra, arithmetic, number properties, rates, ratios, statistics basics | Solving too much instead of judging sufficiency |
| Multi-Source Reasoning | Two or more tabs with text, tables, charts, emails, notes, or reports | Synthesizing evidence, reconciling sources, inference, relevance | Reading every word before reading the question |
| Table Analysis | Sortable table plus true/false or yes/no statements | Sorting, filtering, ranking, comparisons, percentages, ratios | Ignoring units or using the wrong denominator |
| Graphics Interpretation | Graph/chart plus one or two dropdown statements | Reading axes, scales, trends, interpolation, percent change | Misreading scale intervals or labels |
| Two-Part Analysis | A table of answer choices with two linked selections | Constraint solving, simultaneous decisions, trade-offs, algebraic setup | Treating the two columns as independent when they interact |
4. General Preparation Strategy
DI preparation should be built in layers. Students often struggle because they jump directly into timed mixed practice. That feels realistic, but it hides the reason for errors. A better sequence is: first master the question type, then master the data format, then master timing.
- Build the foundation: refresh percentages, ratios, weighted averages, rates, basic statistics, translating words into equations, and reading charts.
- Learn the five question types separately. For one week, do not mix everything. Practice Data Sufficiency as Data Sufficiency, Table Analysis as Table Analysis, and so on.
- Create a repeatable first-30-seconds routine for each type. DI rewards process more than raw cleverness.
- Move from untimed accuracy to light timing, then full section timing. Many students improve faster when they first explain questions slowly, then speed up.
- Keep an error log. The most useful DI error categories are: misread question, wrong source, wrong unit, wrong denominator, calculation mistake, insufficient/over-sufficient logic mistake, and time trap.
- Practice official questions and full-length mocks. Official sources are especially important because DI wording and scoring behavior can be more subtle than third-party drills.
5. Timing Strategy: Win the Section Before the Last Five Minutes
The arithmetic average is 2.25 minutes per question, but DI is uneven. A short Data Sufficiency question might take 60 to 90 seconds. A dense Multi-Source Reasoning set might take three minutes or more. Do not force equal time on unequal problems. Instead, use checkpoints.
| Clock time used | Target progress | What to do if behind |
|---|---|---|
| 15 minutes | Around question 7 | Stop trying to rescue one hard question; mark and move. |
| 30 minutes | Around question 14 | Protect the final six questions; avoid new deep dives. |
| 40 minutes | Around question 18 | Use fast elimination; do not leave blanks. |
| 45 minutes | Question 20 submitted | Review only if time remains after all questions are answered. |
6. Data Sufficiency: Preparation Tips and Shortcuts
Data Sufficiency asks whether the statements provide enough information to answer the question. The correct response is about sufficiency, not about the final numeric value. This is why many students lose points even after doing correct math: they solve when they only needed to judge.
- Memorize the five answer patterns until they are automatic.
- Rephrase the question before testing the statements. Convert “What is x?” into “Do we have one unique value of x?” and convert yes/no questions into “Is the answer always yes or always no?”
- Test statement (1) alone and statement (2) alone before combining. Never let information from one statement leak into the other.
- For yes/no questions, sufficiency means a consistent yes or a consistent no. If a statement sometimes gives yes and sometimes no, it is insufficient.
- Use smart numbers for variables and extremes for inequalities. One counterexample is enough to prove insufficiency.
- Do not calculate beyond certainty. Once a statement gives a unique answer, stop.
7. Multi-Source Reasoning: Preparation Tips and Shortcuts
Multi-Source Reasoning presents several tabs or sources. The challenge is not memory; it is source selection. Strong students do not read every tab with equal attention. They scan the headings, read the question, then open only the sources needed.
- Read tab titles first and form a map: “policy,” “table,” “email,” “chart,” “definitions.”
- Read the question before deep reading the sources. Let the task tell you where to look.
- Use the wording in the answer choices as search terms. Names, dates, categories, and units usually point to the relevant tab.
- When sources conflict, trust the source specified by the question or the most direct evidence in the prompt.
- For inference questions, choose what must follow from the provided data, not what sounds reasonable in the real world.
8. Table Analysis: Preparation Tips and Shortcuts
Table Analysis questions often look easy, but they punish careless comparison. Because tables can usually be sorted, the shortcut is to sort by the column that matches the condition. Then compare only the relevant rows.
- Before calculating, identify the denominator. Most table errors are percentage-base errors.
- Sort columns aggressively: highest/lowest, dates, category, revenue, cost, margin.
- Add a quick handwritten note for derived quantities: margin = revenue − cost; rate = output⁄time; share = part⁄whole.
- For true/false grids, treat each row as a separate mini-question. One unsupported word can make a statement false.
- Watch “at least,” “no more than,” “greater than,” and “from 2024 to 2025” wording.
9. Graphics Interpretation: Preparation Tips and Shortcuts
Graphics Interpretation tests your ability to read visual data. The most common traps are axis scale, unit mismatch, and confusing absolute change with percentage change.
- Read the title, axes, labels, units, and legend before the statement.
- Estimate first. If answer options are far apart, exact calculation may be unnecessary.
- For percent change, use (new − old) ⁄ old, not the difference divided by new.
- Check whether the graph is cumulative, monthly, average, indexed, or percentage-based.
- Do not assume equal visual spacing means equal numeric spacing unless the axis confirms it.
10. Two-Part Analysis: Preparation Tips and Shortcuts
Two-Part Analysis asks for two linked selections. The same answer choice may sometimes be used for both columns. The fastest path is often to set up the constraint and eliminate options that violate it.
- Translate the story into variables, even if the final answer choices are verbal.
- Solve the easier column first if one side has a tighter condition.
- Use elimination across both columns. An option that makes one column impossible is gone.
- Check whether the two answers must be different. Do not assume they must be different unless the question says so.
- For rate, mixture, and work questions, organize the information in a small table.
11. Sample Questions with Guided Solutions
The following examples are original practice-style questions created for this guide. They are not official GMAT questions, but they are designed to demonstrate the same reasoning habits that DI rewards.
(1) 3 notebooks and 2 pens cost $17.
(2) 2 notebooks and 3 pens cost $13.
- Statement (1) alone is sufficient, but statement (2) alone is not sufficient.
- Statement (2) alone is sufficient, but statement (1) alone is not sufficient.
- Both statements together are sufficient, but neither alone is sufficient.
- Each statement alone is sufficient.
- Statements together are not sufficient.
Answer: C
Why: Each statement alone has two unknowns, so neither gives a unique notebook price. Together, the two equations can be solved for both prices, so the notebook price is uniquely determined. Notice that you do not need to finish the arithmetic once uniqueness is clear.
Sample 2 - Table Analysis
Use the table to evaluate the statements below.
| Product | Units sold | Revenue ($) | Ad spend ($) |
|---|---|---|---|
| A | 1,200 | 36,000 | 4,800 |
| B | 900 | 31,500 | 6,300 |
| C | 1,500 | 45,000 | 7,500 |
| D | 600 | 24,000 | 3,000 |
Question: Determine whether each statement is true or false.
| Statement | Answer | Explanation |
|---|---|---|
| Product D had the highest revenue per unit. | True | $24,000 ⁄ 600 = $40, higher than A and C ($30) and B ($35). |
| Product C had the lowest ad spend per unit sold. | False | C: $7,500 ⁄ 1,500 = $5; D: $3,000 ⁄ 600 = $5; they are tied, so C is not uniquely lowest. |
| Product B spent 20% of revenue on ads. | True | $6,300 ⁄ $31,500 = 0.20. |
Sample 3 - Graphics Interpretation
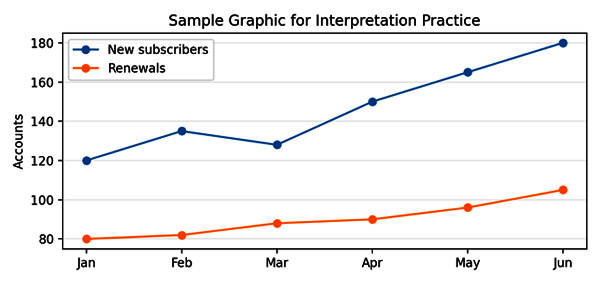
| Dropdown 1: New subscribers | Dropdown 2: Renewals |
|---|---|
| 50% | 31% |
| 33% | 25% |
| 25% | 20% |
Answer: New subscribers: 50%; renewals: about 31%.
Why: New subscribers rose from 120 to 180, a gain of 60 on a base of 120, or 50%. Renewals rose from 80 to 105, a gain of 25 on a base of 80, or 31.25%.
Sample 4 - Two-Part Analysis A company will buy exactly 10 devices. Tablets cost $300 each and laptops cost $700 each. The total budget is $4,600. Select the number of tablets and the number of laptops. |
- Tablets: 2, 3, 4, 5, 6, 7, 8
- Laptops: 2, 3, 4, 5, 6, 7, 8
Answer: 6 tablets and 4 laptops
Why: Let T + L = 10 and 300T + 700L = 4,600. Substitute T = 10 − L: 300(10 − L) + 700L = 4,600, so 3,000 + 400L = 4,600 and L = 4. Thus T = 6.
Sample 5 - Multi-Source Reasoning Tab 1 says a supplier charges a 5% late fee when payment is received after 30 days. Tab 2 shows Invoice 104 was issued on March 1 for $8,000 and paid on April 5. Tab 3 says fees are calculated on the original invoice amount, not on tax. What late fee should be recorded? |
- $0
- $40
- $400
- $420
- Cannot be determined
Answer: C
Why: The payment was after 30 days, so the late fee applies. The fee is 5% of $8,000 = $400. The key is to combine the policy tab, invoice tab, and calculation rule tab without adding irrelevant tax information.
12. High-Yield DI Shortcuts and Micro-Skills
| Situation | Shortcut |
|---|---|
| Percent increase/decrease | Use change ⁄ original. Write the original number next to the question before calculating. |
| Comparing ratios | Cross-multiply instead of converting every ratio to decimals. |
| Large numbers in tables | Drop common zeros if all values share the same scale. |
| Yes/no Data Sufficiency | Try to produce one yes and one no. If both are possible, the statement is insufficient. |
| Graph with uneven scale | Read tick marks before estimating. Never judge by visual height alone. |
| Multi-source overload | Read questions first, then search sources. Build a tab map, not a full memory of every sentence. |
| Two-part choices | Solve the constrained side first and use it to eliminate rows or columns. |
| Review screen | Mark only questions you can realistically fix; do not review everything. |
13. Four-Week Practical Study Plan
| Week | Main goal | Daily work | End-of-week test |
|---|---|---|---|
| 1 | Foundation and question-type learning | 30-45 minutes quant basics; 30 minutes chart/table reading; 10 untimed DS or Table Analysis questions with written explanations | One untimed mixed DI set; identify top three error types |
| 2 | Accuracy by type | Rotate question types; review every error; build flashcards for traps and formulas | Two 20-question DI sets without strict timing, then review deeply |
| 3 | Timed skill building | Use 10-question timed sets; practice the 15-minute checkpoint strategy; drill weakest type | One full DI section simulation |
| 4 | Exam readiness | Full mocks, review screen practice, targeted cleanup; reduce new resources | Two full mock exams with full review and pacing analysis |
14. Error Log Template
| Question type | Error category | What I did | Correct trigger | New rule |
|---|---|---|---|---|
| Table Analysis | Wrong denominator | Divided ad spend by total revenue instead of product revenue | Question asked “for that product” | Circle the denominator before calculating |
| Graphics Interpretation | Axis misread | Read each tick as 5 instead of 10 | Y-axis labels changed every two gridlines | Read first, second, and final tick before estimating |
| Data Sufficiency | Statement leakage | Used statement (2) while judging statement (1) | Statements must be isolated | Write S1 alone / S2 alone / together |
15. Test-Day Execution Plan
- Choose section order strategically. Many students prefer not to place DI last if their mental energy drops after Quant and Verbal.
- During the first minute of DI, commit to pacing. Do not let the first hard question define the section.
- Use the on-screen calculator for arithmetic, not for thinking. Set up the expression first; then calculate.
- Mark questions that are genuinely revisable, especially Data Sufficiency or table questions where a second look may reveal a misread word.
- Do not leave any question unanswered. If stuck, eliminate what you can, choose, mark, and move.
- Use the review screen only after all questions are attempted and only for questions where a specific issue was marked.
16. Final Checklist Before the Exam
| Can you do this confidently? | Yes/No |
|---|---|
| Explain the five DI question types and the best first step for each. | |
| Use 15-minute pacing checkpoints without panic. | |
| Read graphs by title, axes, units, and legend before solving. | |
| Sort tables and choose the correct denominator quickly. | |
| Apply Data Sufficiency answer patterns without hesitation. | |
| Decide when to guess and move on. | |
| Review errors by category, not just by answer. | |
| Complete at least two full DI timed sections before test day. |